WITH KEY ACTIVE ECHOVECTORS,
FORECAST ECHOVECTORS
ECHOBACKDATES
AND ECHOVECTOR PIVOT POINTS
ILLUSTRATED AND HIGHLIGHTED
Along with gold, silver's dramatic price drop has been in the news this year, and recently many articles have started to appear suggesting that a potential bounce in silver prices may now be coming.
In this regard, today is a very timely day for a review of the annual silver price chart from an Echovector Price Analysis Perspective for the occurrence of possible annual price symmetries that may be forming, and these formation's trading implications.
In this analysis I will focus on a daily action price chart of the SLV ETF as our price chart proxy for silver metals market price action.
SLV ETF 18-MONTH DAILY OHLC
SLV ETF 18-MONTH DAILY OHLC
(Right click on presented image of chart to open image of chart in new tab. Left click on new image of chart opened in new tab to further zoom and enlarge EchoVector Analysis chart image illustrations and highlights.)
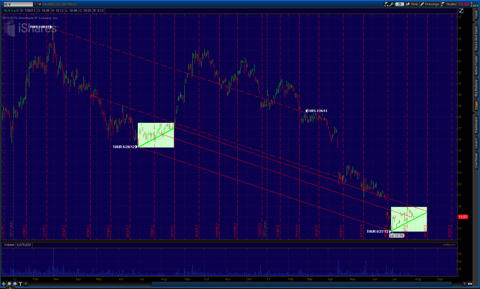
Looking at the chart above, we can see a very significant and clear symmetry may be emerging in the key active annual echovector re-affirmed from the this year's current low (about a month ago) on Thursday June 27, and the low from its corresponding echo-back-date one year earlier on Thursday June 28, 2012.
The trade price box that followed until its breakout last August 20TH appears so far to be reforming this year and in remarkable coordination.
This echovector price detection presents a potentially interesting swing trade assessment opportunity starting this week, which goes to the beginning of August and on to August's significant 3RD Saturday options expiration date as well.
From there we note silver's strong price up-draft occurred last year and lasted well into mid-September.
This price activity last year might seem particularly compelling and suggestive from a echovector pivot point analysis point of view regarding silver's outlook over the next month this year's potential swing trade.
The more astute analysts will likely focus from now forward on silver's price action within the green highlighted time-price box this year depicted on the chart, especially if silver's price action forward stays above the ascending green echo-price support vector within the box that corresponds to silver's price path last year within the same timeframe.
You can see CommodityPivots for further updates that might develop regarding this analysis.
Thanks. And good luck in your silver investing and trading!


No comments:
Post a Comment